Each month, EIOPA publishes a set of technical parameters used to produce the economic balance sheet, the SCR and the solvency ratio:
- Risk-free yield curves
- Volatility adjustment
- Symmetric adjustment
On this page, Addactis centralizes these various publications and puts these parameters into perspective with their levels in previous orders.
You can download the data history in Excel format at the bottom of this page.
Summary of data as of 11/30/2025
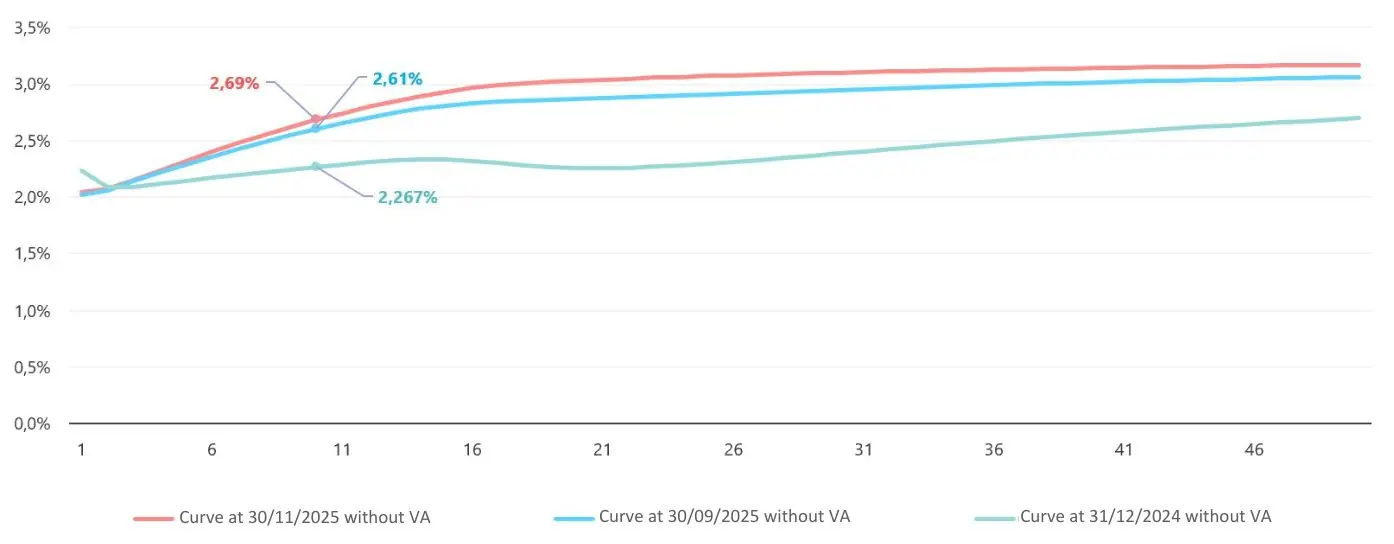
Risk-free rate curve
Volatility adjustment (bps)
Symmetric adjustment
Parameter summary

Risk-free yield curve and volatility adjustment
Construction of the risk-free yield curve
Every month, EIOPA constructs the risk-free yield curve from swap rates for maturities of 1 to 10 years, 12 years, 15 years and 20 years, from which a Credit Risk Adjustment (CRA) is deducted at a value of between 0.10% and 0.35%:
Risk Free Rate(RFR) = Swap Rate – Credit Risk Adjustment (CRA)
The yield curve is then constructed by interpolating maturities below the LLP (Last Liquid Point, 20 years), then extrapolated to converge towards the UFR (Ultimate Forward Rate) over a 60-year horizon, using the Smith Wilson method. The 2020 revision of Solvency II will eventually introduce a new extrapolation methodology.
Rate shocks

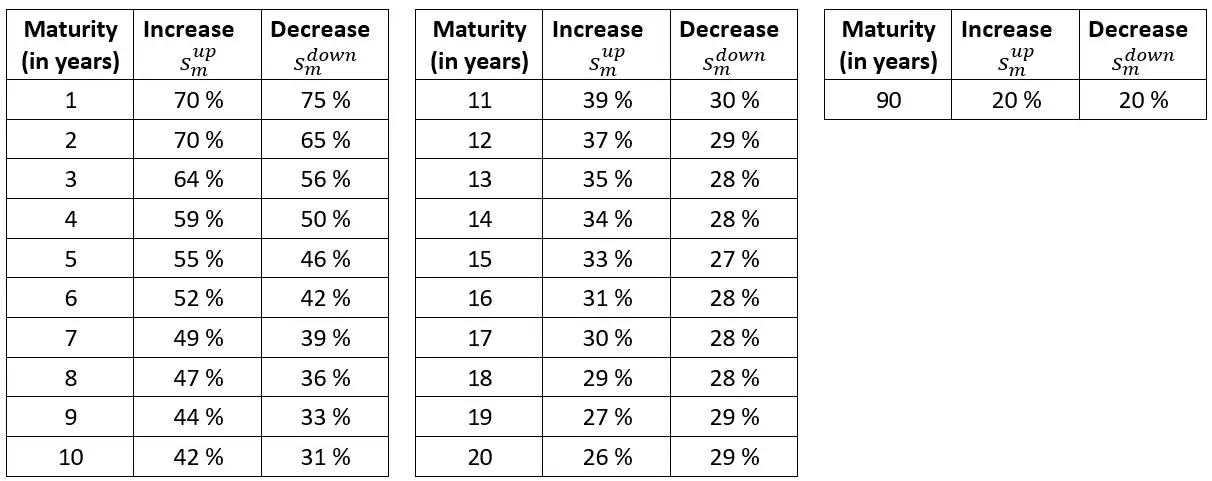
The 2020 revision of Solvency II will modify the methods used to calculate interest rate shocks, to take better account of the specificities of low or even negative interest rate environments.
Ultimate Forward Rate (UFR)
EIOPA determines the UFR annually from the sum of a real rate component and an expected inflation component (for the euro, this is the ECB’s inflation target of 2%). The annual variation of the UFR is limited to +/- 15 bps. UFR rises from 3.45% in 2023 to 3.30% in 2024.
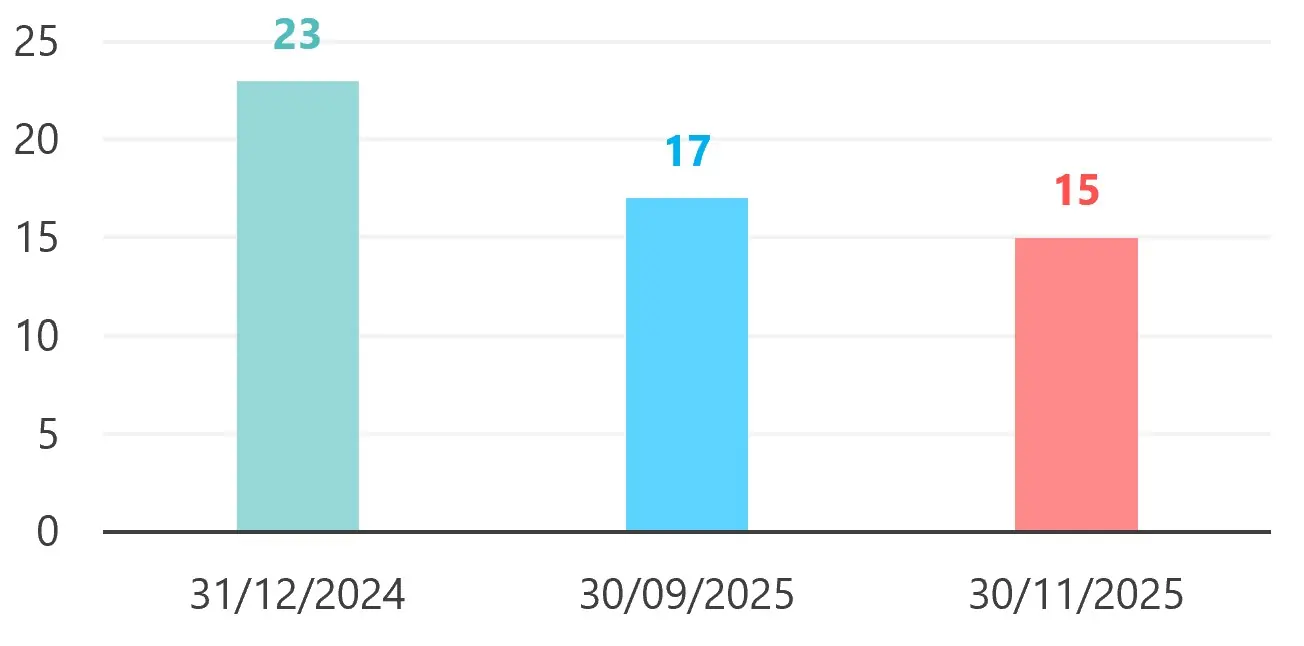
Volatility adjustment (VA)
Every month, EIOPA determines the euro currency volatility adjustment based on a portfolio representing the euro-denominated investments of European insurers. This portfolio includes sovereign and corporate bonds, as well as equities and real estate. The volatility adjustment is equal to the risk-adjusted spread of corporate and sovereign bonds.
First, a spread of the representative portfolio is calculated.

where :
- wgov and wcorp are the respective weights of sovereign and corporate bonds in the representative portfolio with wgov + wcorp + wequity + wproperty = 1
- Sgov and Scorp are the respective spreads of sovereign and corporate bonds.
The Risk Adjustment is then calculated as follows:


The 2020 revision of Solvency II will change the way the volatility adjustment is calculated, making it specific to each company.
To find out more about EIOPA’s methodologies for calculating the risk-free yield curve and adjusting for volatility, you can find EIOPA’s full technical documentation here.
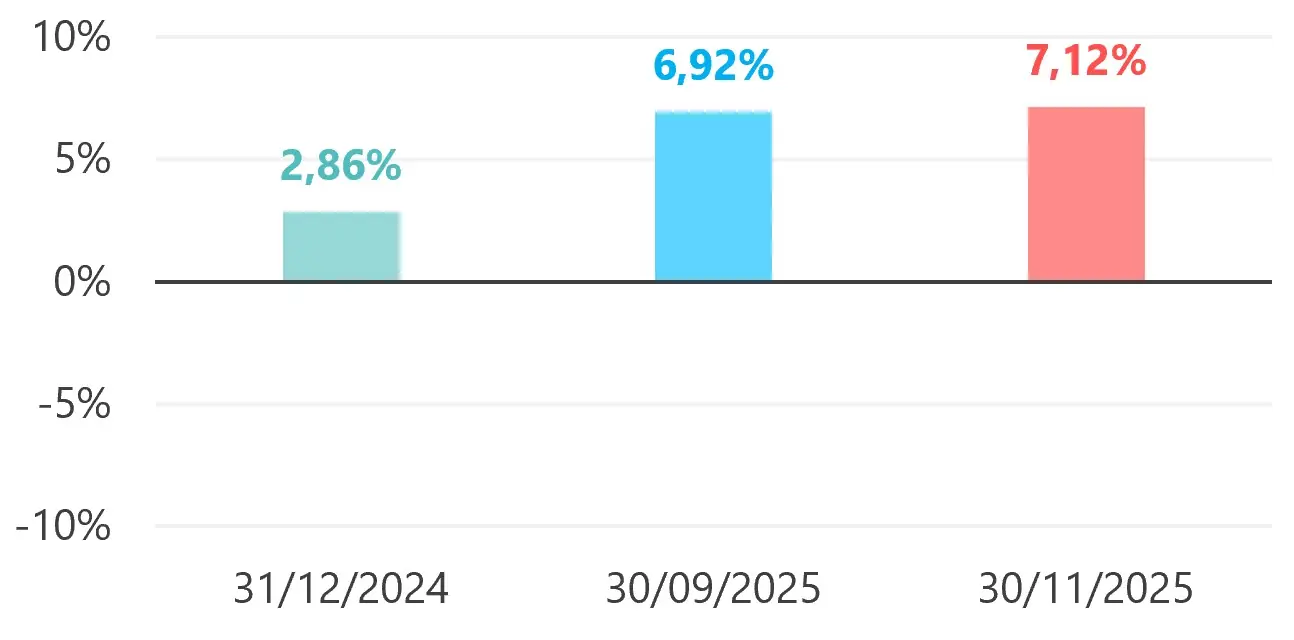
Symmetric adjustment
The symmetric adjustment (SA) modifies the level of equity shocks in the Standard Formula (type 1 at 39% and type 2 at 49%) to take account of market cycles. To determine it on a monthly basis, EIOPA has constructed an index replicating the average characteristics of assets held by insurers, and the symmetric adjustment is calculated from the difference between the last value of this index and the 3-year moving average of the index, according to the following formula:

The value of the symmetrical adjustment is between -10% and +10%.
The 2020 revision of Solvency II should widen the symmetrical adjustment corridor to +/- 13%.
The benchmark index is composed of :
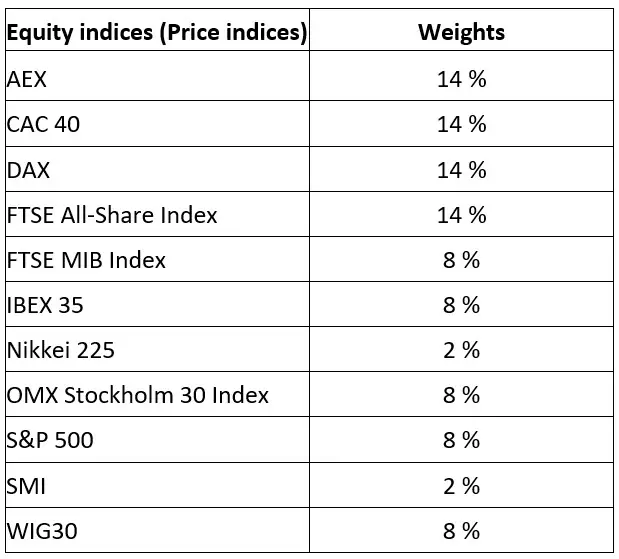
To find out more about EIOPA’s methodologies, you will find the full technical documentation on the EIOPA website.
Future developments – Solvency II 2020 Review
The 2020 review of Solvency II is expected to bring a number of changes:
- the methodology used to construct the risk-free yield curve (notably extrapolation, with and without correction for volatility)
- to calculate the volatility adjustment
- at the terminals of the symmetrical fit
To find out more about the 2020 review of Solvency II, read the summary written by our experts.
Would you like to be informed each quarter of rate updates? Leave us your contact details!


