From Epidemiological Dynamics to Machine Learning
Epidemiological spread, which is particularly strong in the case of COVID-19, can be modelled using mathematical approaches – as SIRD and SIERD modelling (Read the article “The Orginis of epidemiological dynamics”) – that make it possible to quantify the number of confirmed cases as well as the epidemic dynamics.
A complementary approach to epidemic spread study, which does not require precise knowledge of this complex dynamics, consists in studying the profiles of infected persons and their severity. In a probabilistic approach, it involves the definition of profiles according to COVID-19 features of hospitalized patients (mild hospitalization, resuscitation, lethality, etc.) conditionally on their contamination or hospitalization.
The Bayes’ formula allows us to separate the effects of the epidemic dynamics from the impact of an infected and hospitalized person. For example, using the probability that a patient goes into resuscitation, the Bayes decomposition gives the following result:

Thus, the risk for a patient to be sent to ICU can be decomposed into three factors, respectively:
- His risk of being contaminated
- His risk of being hospitalized (first-order severity)
- His risk of being resuscitated (second-order severity)
Since not all contaminated persons are tested, hospitalized and followed up, this article is focused on the third factor, which is the risk of being resuscitated for an inpatient.
For a hospitalized COVID-19 patient , the target probability of being resuscitated is:
In practice, the estimate of the COVID-19 hospitalization rate depends strongly on the test capacity, which is a fully fledged issue that will not be discussed here and which is also investigated by our COVID-19 Taskforce.
Furthermore, the daily evolution of the number of people entering resuscitation is naturally highly correlated with the number of inhabitants in the area under consideration. Our approach is to set aside this high correlation since we are studying a ratio of admissions to intensive care among hospitalized patients. Nevertheless, the number of inhabitants can be considered in the modelling.
See below the distribution of resuscitation in France, in number and proportion of hospitalized patients:
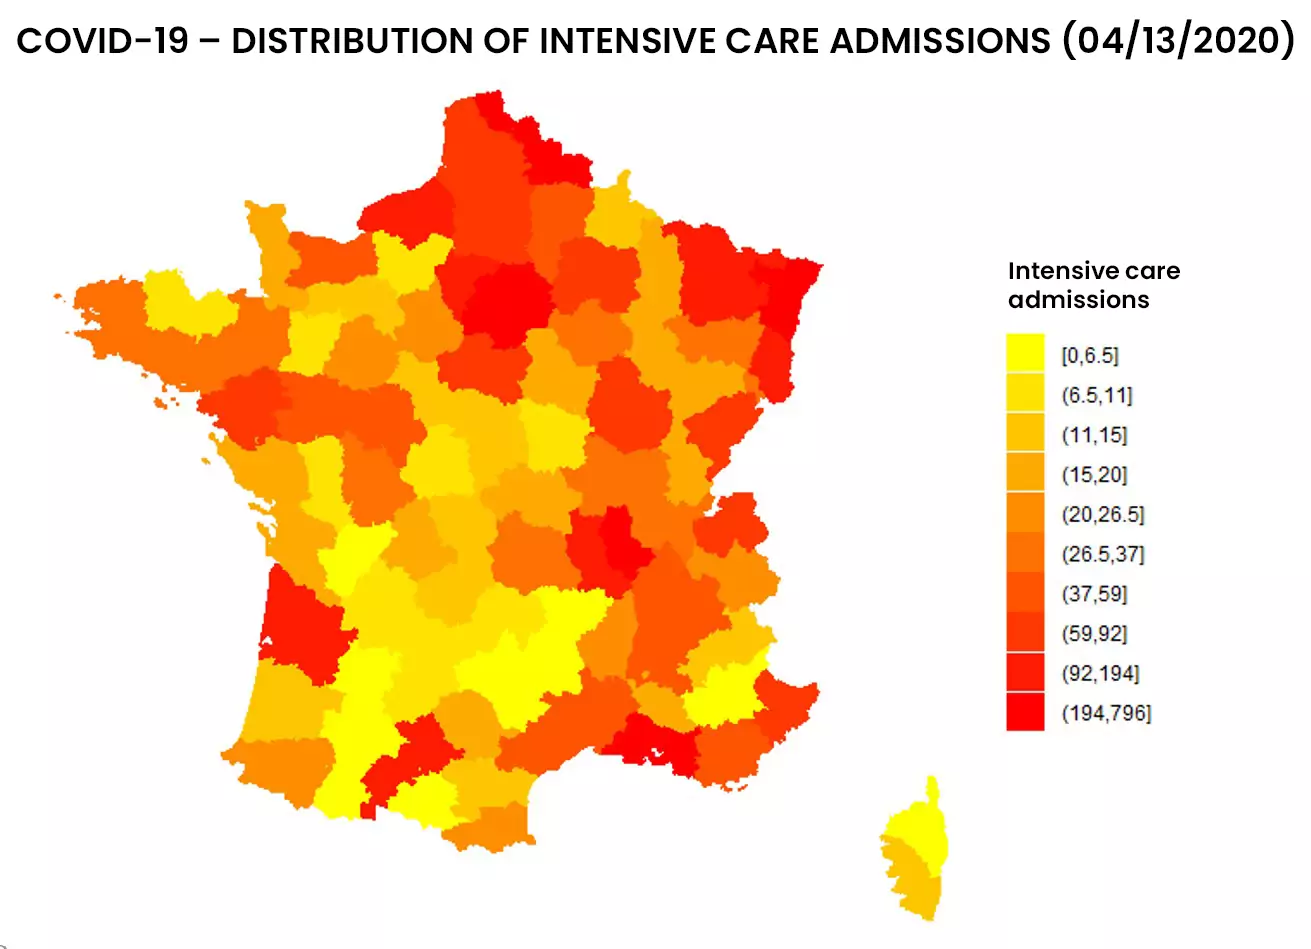
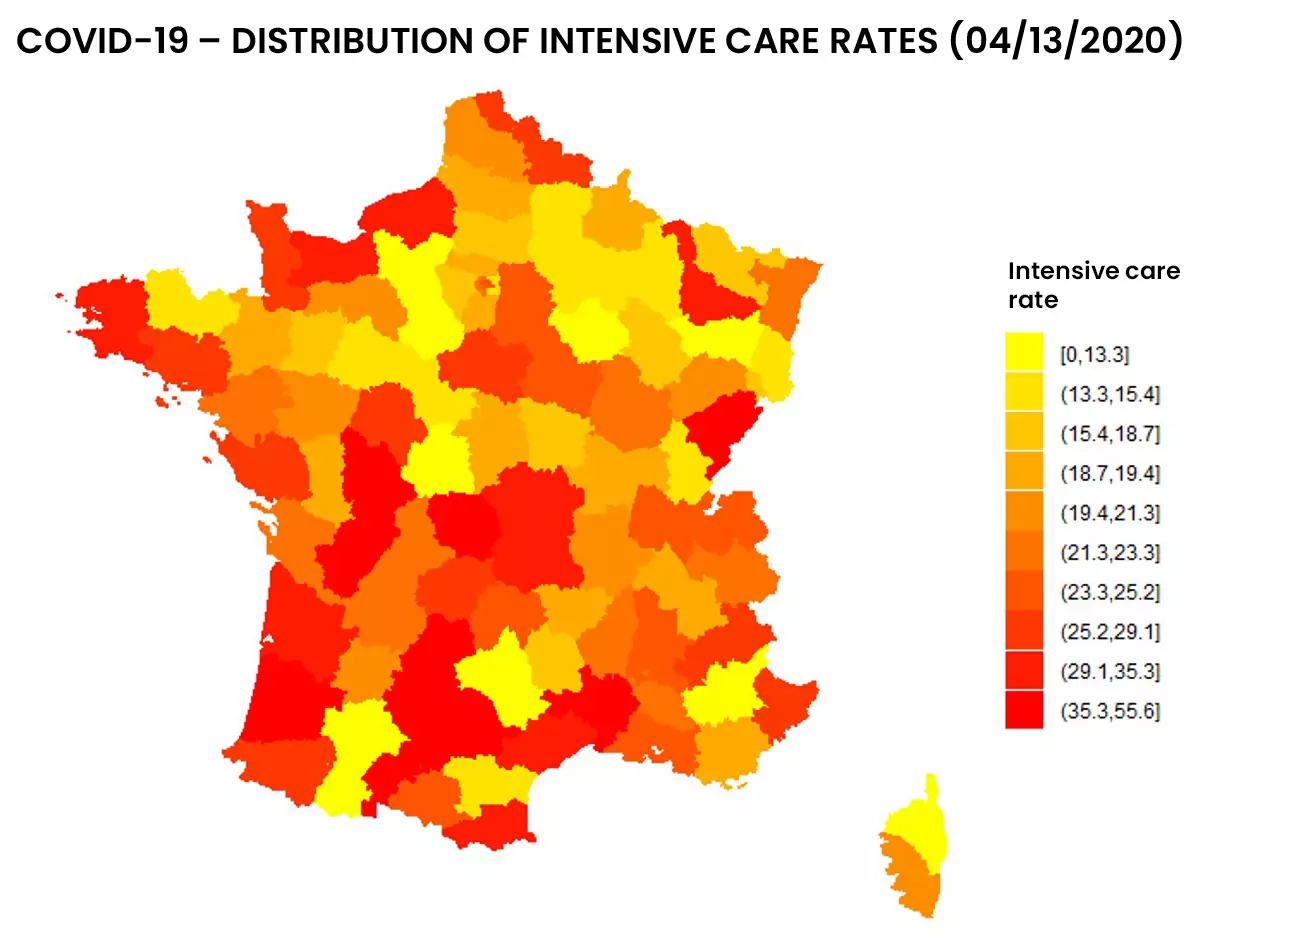
Figure 1: Distribution of entries and resuscitation rates as of 04/13/2020 by addactis® Detect
We can observe a disparity between the number of resuscitations and the proportion of resuscitations per hospitalization, which indicates a certain degree of severity. A more detailed analysis taking into account the evolution over time of those indicators in different areas of France makes it possible to describe this severity and follow it over time. These temporal analysis will be presented in a subsequent article.
Modelling the probability for an inpatient to enter resuscitation can be done using the Statistical Learning framework with Machine Learning algorithms, thanks to inpatient records and related data set constructed before.
Inpatient data is critical
Medical research widely uses statistical modelling and learning techniques, particularly in research institutes (INSERM, Institut Pasteur, etc.). Such studies can help diagnose certain diseases such as cancer, identify risk factors, determine the reliability of a treatment, etc.
Therefore, the accuracy and completeness of patient data is essential for these studies. Concerning COVID-19, the medical scientific community shares data at international level so that each country or region can supply their models taking into account their own characteristics.
These health data have a level of accuracy that prevents their public release. Several data platforms around the world offer data aggregated by territory, as data.gouv portal in France provides data at departmental level, John Hopkins University, etc..
Contextualization of patient data – external data
Another issue before the modelling is the contextualization of patient data, for example, information that can contribute to explain the resuscitation. Among these informative data, we find of course the nominal features of patients (age, sex, BMI, etc.), but also co-morbidity factors (diabetes, hypertension, etc.) – whose impact can be quantified. In addition, it is also relevant to study “external” factors, particularly those linked to the geographical area where the patient lives or to his activities (pollution, number of medical beds, road infrastructures, public transportations, etc.).
This contextualization work requires first the definition of indicators, then the collection and aggregation with the patient database.
It should be pointed out that all these data vary over time, as the health evolution due to the epidemic spread, which increases the information available at time t. The integration of this temporal dimension in the models requires specific approaches that will be the subject of a subsequent article. Therefore, the present study focus on the health situation at a given time.
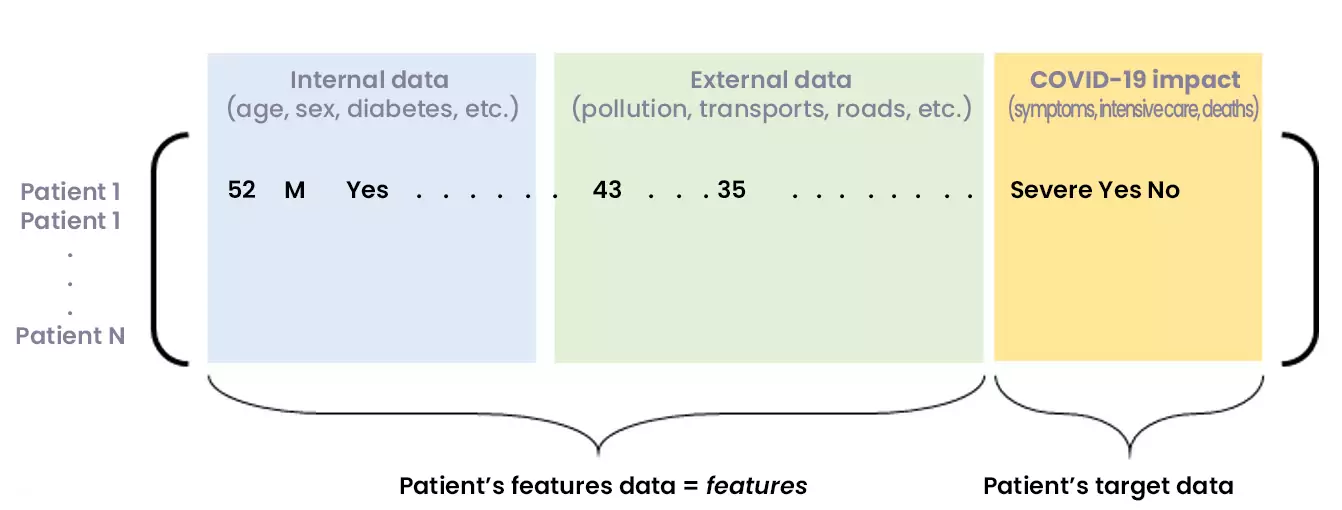
Figure 2: Matrix of consolidated internal and external data, showing COVID-19 consequences for a set of patients
The constitution and consolidation of an exhaustive and reliable database allows the construction of Machine Learning models. This leads to learning a target variable related to the COVID-19 impact on a patient (probability of entry into resuscitation, severity, lethality, etc.)
Towards Statistical Learning
Descriptive and correlation analysis of the consolidated data is a preliminary step to modelling.
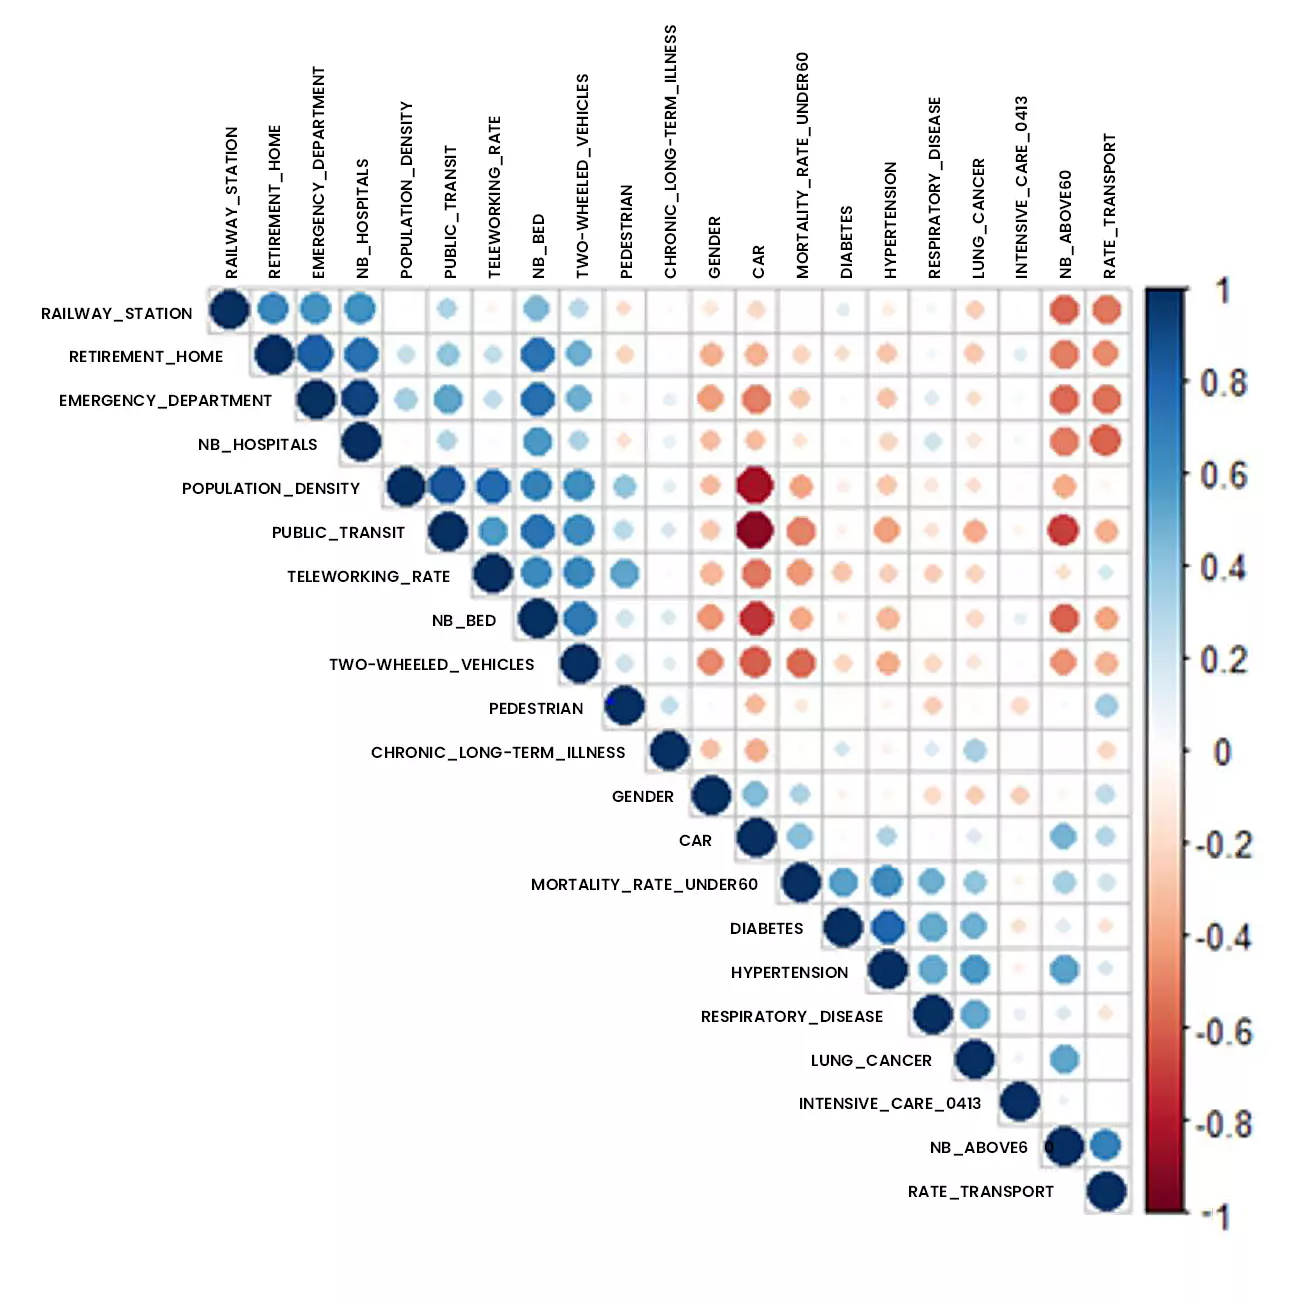
Figure 3: Correlation analysis of data studied using addactis® Detect
In particular, a significant relationship between co-morbidities (hypertension, respiratory disease, diabetes) and hospital admissions into intensive care is established.
For instance, statistical learning allows to define inpatient categories, to identify (internal and external) risk factors and to build explanatory and predictive models of the probability of entering resuscitation.
Several models can be used: logit regression, Random Forest, CART, etc. Only two of those approaches will be presented here: a parametric approach – the logit regression – that aims at modeling the probability for an inpatient to enter resuscitation, and a non-parametric approach – CART binary classification tree.
Let us note the patient vector of an individual (not necessarily present in the initial database) which gathers all the characteristics requested in the database.
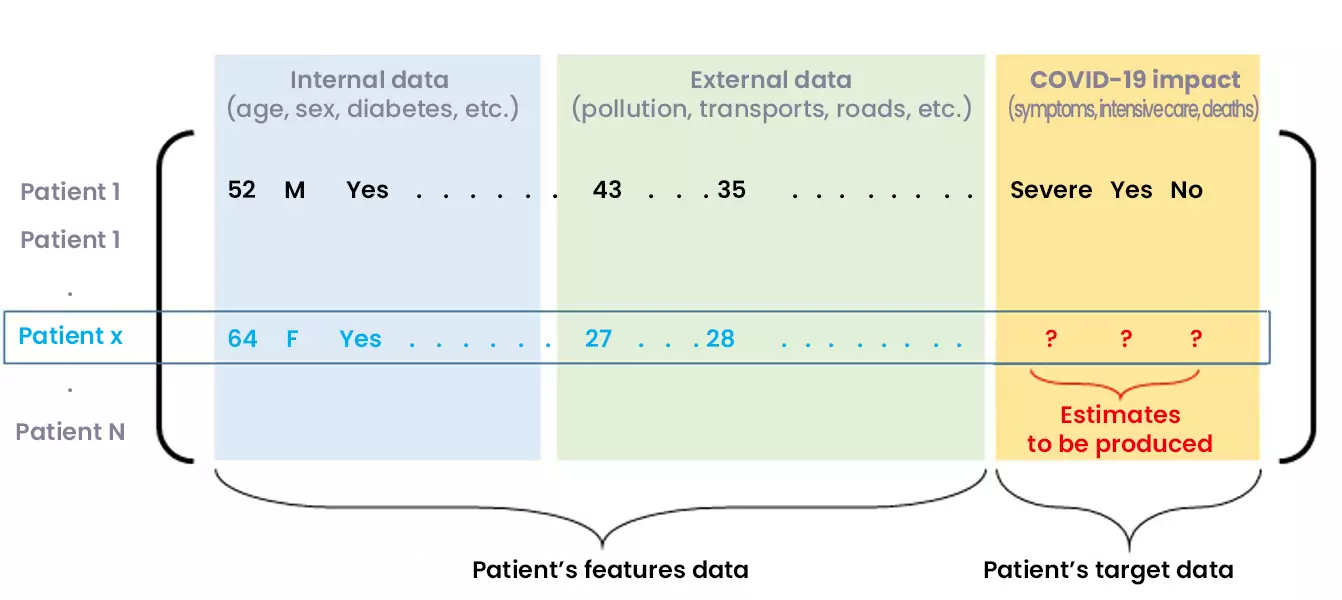
Figure 4: Predicting the COVID-19 impact on a new inpatient
The logit modelling leads to consider the following parametric form of the probability for an inpatient to enter resuscitation:
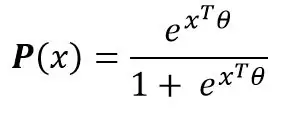
Where the vector of parameter will be estimated from the initial data (maximum likelihood, etc.). Thus, for any inpatient, the probability (or score) of the patient being admitted to intensive care is known. The use of the parameters allows to quantify the effects of each of the parameters on the risk of resuscitation.
The CART method does not lead to assumptions on the model or the data. This is the principle of non-parametric methods where the data “speaks for itself”. This method has the advantage of being highly interpretable through the graphical analysis of the tree learned from the data. The model is no longer just a formula, but also a graph:
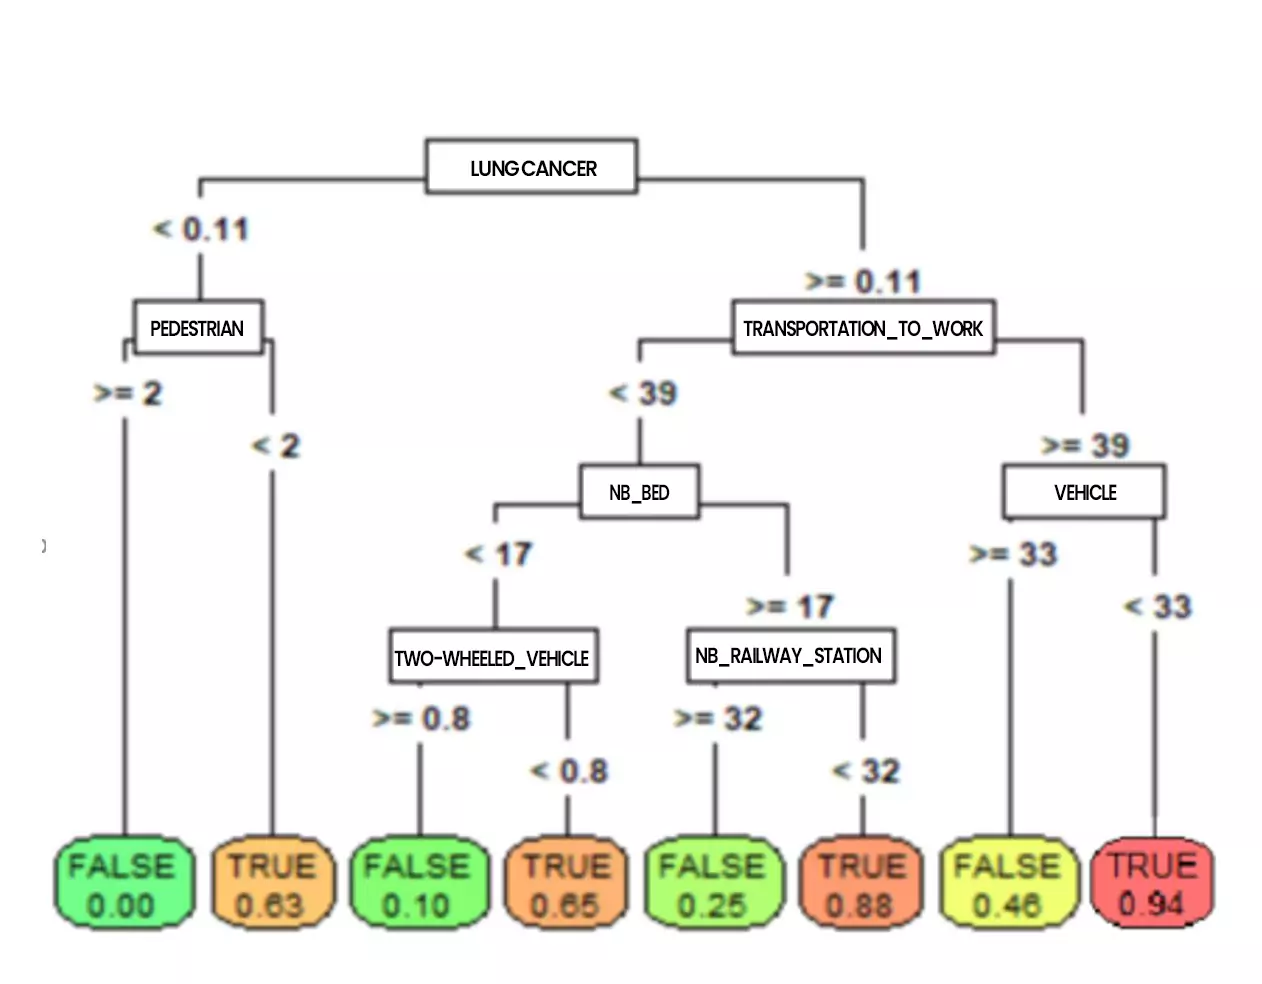
Figure 5: CART tree classifying resuscitation inputs (by addactis® Detect)
Nevertheless, regression and classification trees may show limitations in terms of robustness that should be considered with caution (more robust models can then be built).
On such a tree, the probabilities to enter resuscitation can be read directly at the bottom of the trees (the terminal leaves). It also allows to go back up on the characteristics leading to such a risk (we will talk about profile). For example, the tree above shows that a patient who had cancer or serious lung problems and who moves frequently without using his vehicle has a very high risk of entering resuscitation. We can also see that pedestrian activity reduces the risk of entering resuscitation.
It is possible to explore more in details the tree by increasing its depth, which will reveal other co-morbidities such as diabetes, hypertension, etc. as well as external factors such as the use of public transportation, etc.
Conclusion
This article aimed to present a complementary approach to the epidemiological modelling of COVID-19, relying on the comprehensiveness of the information on patients and their environment to model the virus impact. This data approach requires access to detailed data on inpatients, and context data that must first be identified and collected. Some of these external data were mentioned. Data related to containment, measures taken by each country area, etc. can also be cited.
Nevertheless, the amount of information collected must not be too high in order to avoid the “well known curse of dimensionality in Machine Learning. A step of dimension reduction is very often necessary, these techniques were used for this study.
The “mass effect” of resuscitation admissions in certain area (due to their population density) was distinguished from the “severity effect” of COVID-19 hospitalization. It should be noted that the proportion of inpatient ICU admissions did not necessarily follow the evolution of the absolute number of ICU admissions.
Taking into account the evolution of data over time is important for understanding the epidemic dynamics, even if Machine Learning context first refers to static data. A subsequent article will present how Machine Learning Models can illustrate and sometimes explain the epidemic dynamics.

