Banner Solvabilité II

EIOPA: Natural Disasters & Insurance Protection

11/07/2023

Dashboard on Insurance Protection Gaps for Natural Disasters

Currently, only one quarter of the overall losses caused by extreme weather events climate-related are insured in Europe.

There is therefore a deficit in protection in terms of NAT CAT insurance. Consequently, EIOPA has established a dashboard whose main objective is to monitor the risks associated with these protection gaps. It compares the risk incurred with the level of protection in 30 European countries for storm, flood, wildfire, and earthquake risks.

The dashboard provides four views of protection gap:

1. Current Protection Gap indicates the existing differences in coverage for a specific risk, analyzed through modeling data provided by RMS, JBA, and Verisk.

2. Historical Protection Gap presents the historical deficiencies in coverage for a specific risk, based on insurance coverage data and economic losses from 1980 to 2021.

3. Country View provides additional information on current and historical protection deficiencies specific to each country.

4. A country insurance perspective provides qualitative information on how natural disasters are covered.
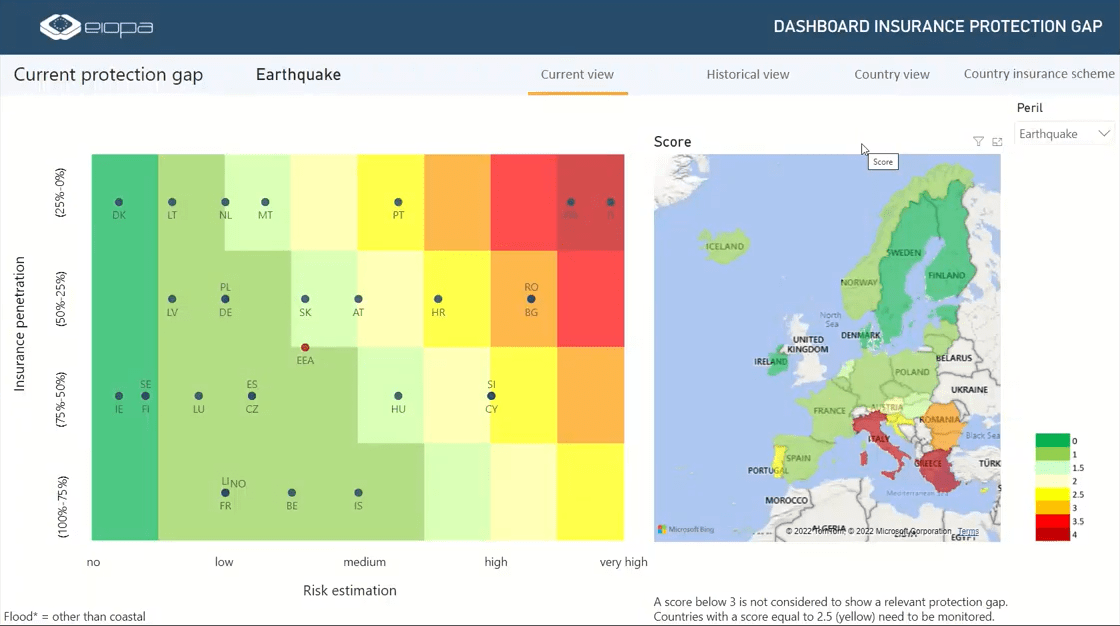
Visuel EIOPA

1. Current Protection Gap

The main concept of the formula used to estimate the current protection gap consists in comparing the risk of a specific peril in a country with the insurance intervention for the corresponding peril/country.

The risk has been compared across different perils and countries using the index below:

Equation Index Claims on GDP
The index compares the aggregated losses of natural disasters with a 200-year return period to the GDP to assess the magnitude of losses suffered by countries’ economies.

The thresholds used to define the scores are the following :

EIOPA Thresholds
To derive the final ratings for risk estimation, EIOPA used the average rating obtained from all models and expert judgments. The average risk scores range from 0 (no risk) to 4 (very high risk).


As to the insurance coverage, it is evaluated using the following formula:

Equation insurance coverage
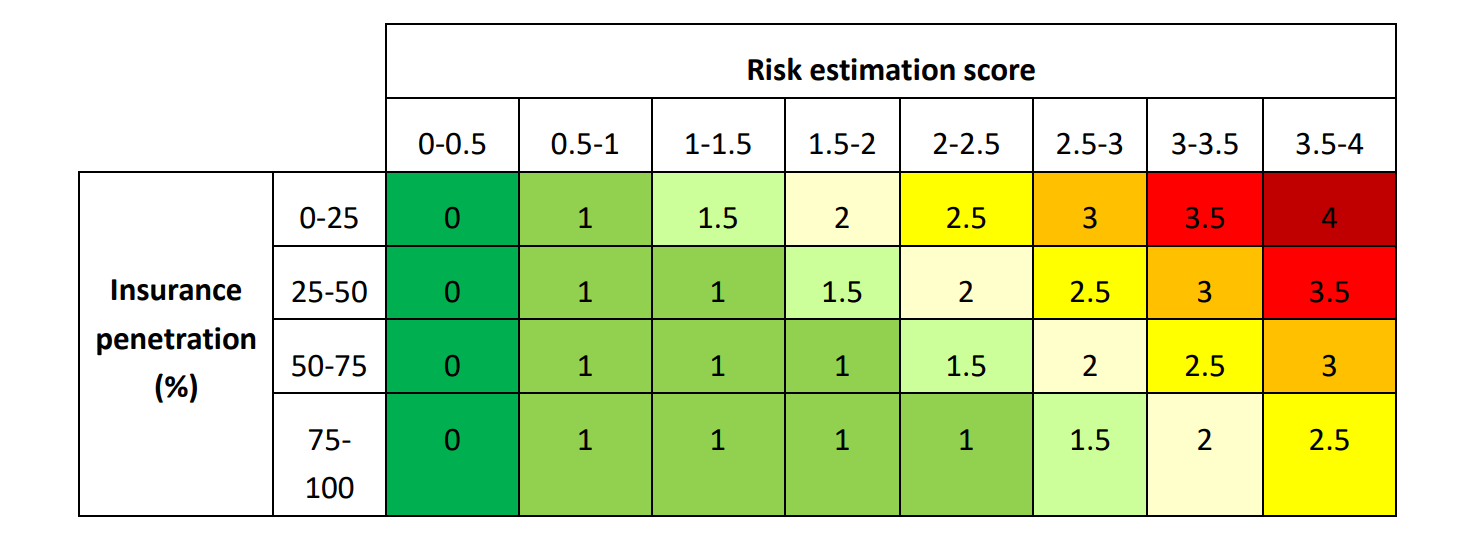
The insured amount refers to the values of properties covered by Natural Disaster policies, and the replacement value corresponds to the cost of reconstruction of buildings. A matrix is thus obtained, which allows for the establishment of a protection score by cross-referencing the level of risk and the corresponding insurance coverage.
EIOPA Risk Estimation Score
The thresholds have been established based on expert judgment to allow for differentiation between a very high protection gap (score = 4), a high protection gap (score = 3), a moderate protection gap (score = 2), a low protection gap (score = 1), and no protection gap (score = 0).

2. Historical protection gap

Two elements are considered to characterize the risk and insurance coverage from a historical perspective (note that these calculations are based on the period 1980-2021).

a. Annual uninsured losses normalized by GDP:

Annual Economic Losses normalized by GPD
EIOPA has decided to normalize the score with GDP to better compare different countries.

b) The percentage of uninsured claims:

uninsured claims
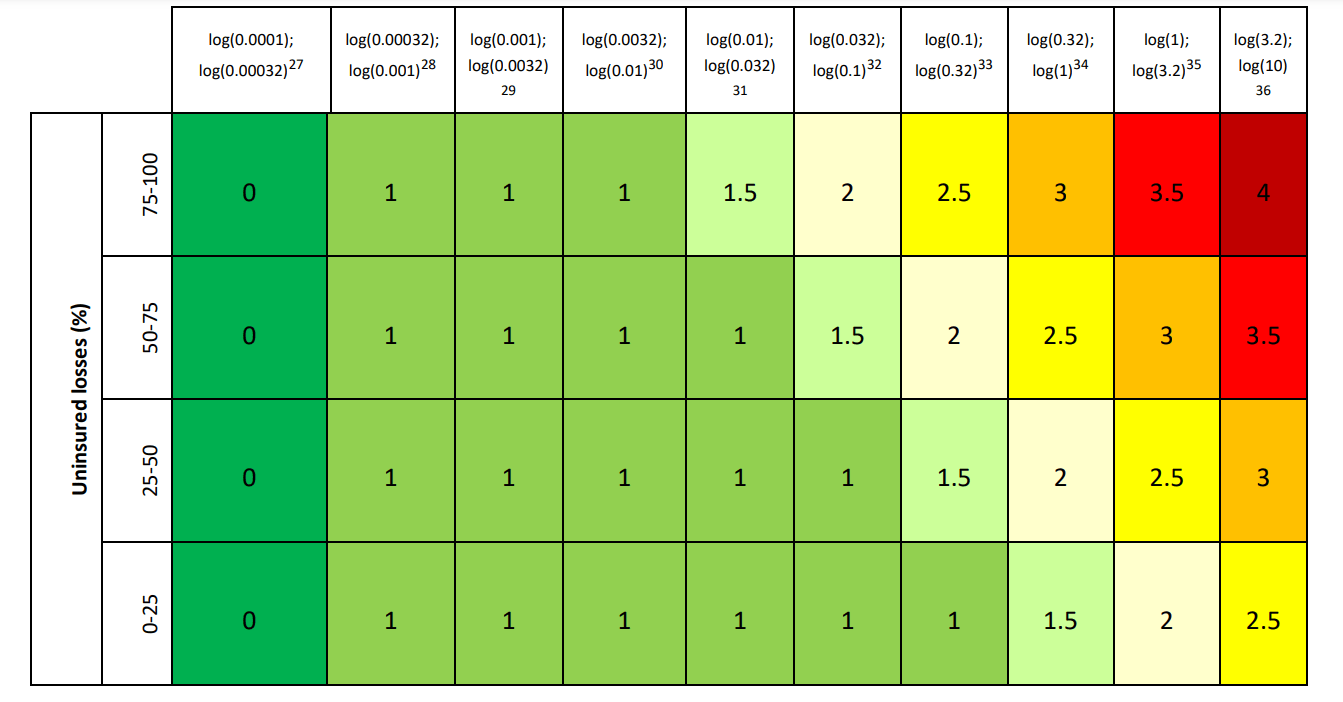
In addition to the normalized view, EIOPA also considers the percentage of uninsured losses, which provides an indication of the coverage rate for economic losses.   The score considers two dimensions: the absolute value of losses for each country per peril (annual economic losses normalized by GDP) and the percentage of uninsured losses. The following figure shows an example of annual uninsured losses normalized by GDP compared to the percentage of uninsured losses (EIOPA has represented the annual economic losses normalized by GDP using its logarithm to better differentiate small values).
EIOPA capture 4
It should be noted that due to different methodologies and data sources, the current and historical scores of the protection gap are not fully comparable and should not be interpreted as an improvement or worsening of the risk.   Indeed, historical losses are mainly based on CATDAT datasets (economic losses and deaths related to weather and climate events from RiskLayer GmbH received by the European Environment Agency (EEA) under an institutional agreement) and EMDAT (open-source data developed by the University of Louvain), while the current risk perspective is based on catastrophe models from major providers such as RMS.

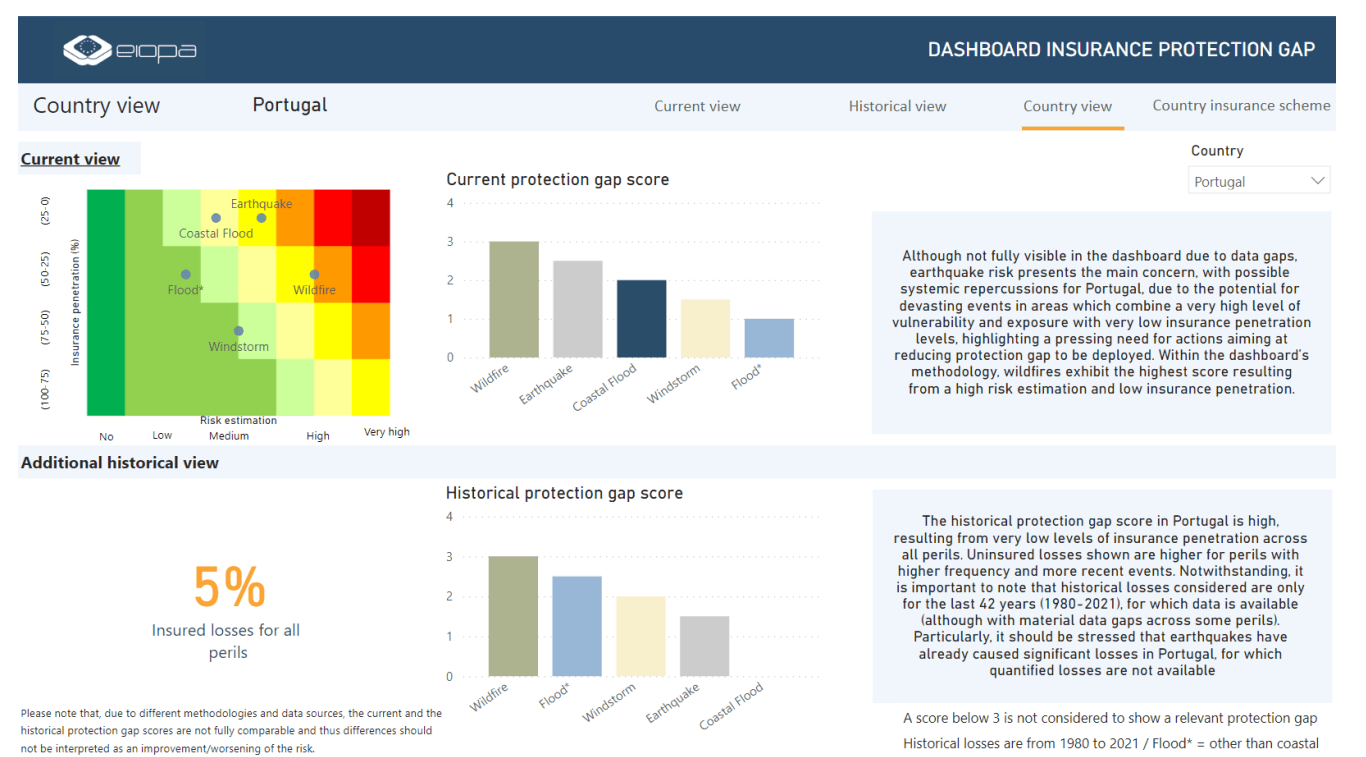
3. Country-specific view

This tab allows for a focus on a specific country and provides an overview of scores for all perils.
EIOPA view

4. Insurance Perspective by Countries
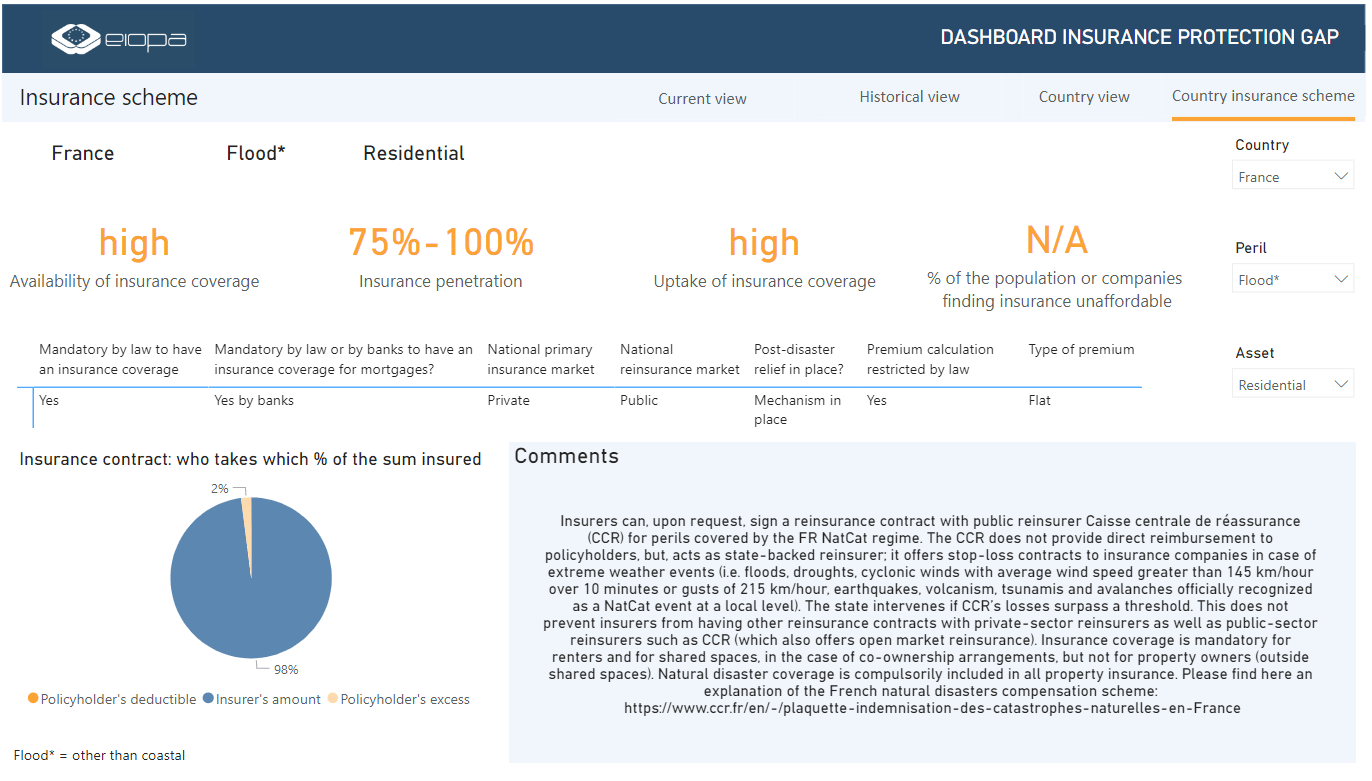
This section allows to gather qualitative information on general practices related to residential and commercial insurance. We have information on premium types, the percentage of insurance coverage participation, post-disaster government funds, the presence or absence of public reinsurance mechanisms, and the presence or absence of mandatory insurance. The assessment results are displayed by selecting a country and peril from a dropdown list.
EIOPA country insurance
Thus, this dashboard will enable monitoring of the risks associated with the Natural Catastrophe insurance protection gap in Europe. Furthermore, increased awareness among all stakeholders regarding protection gap issues is expected.

Moreover, it will help identify the synergy potential between national policies to improve natural disaster protection across European borders.


If you would like to learn more about translating climate risks into prudential risks, our experts are also available to provide further insights.

This article was written by our experts:


Kim POUILLY
Consultant
Modeling & Risk P&C

Romain NOBIS
Manager
Modeling & Risk P&C

Annabelle GARRIGUE
Senior Manager
Modeling & Risk